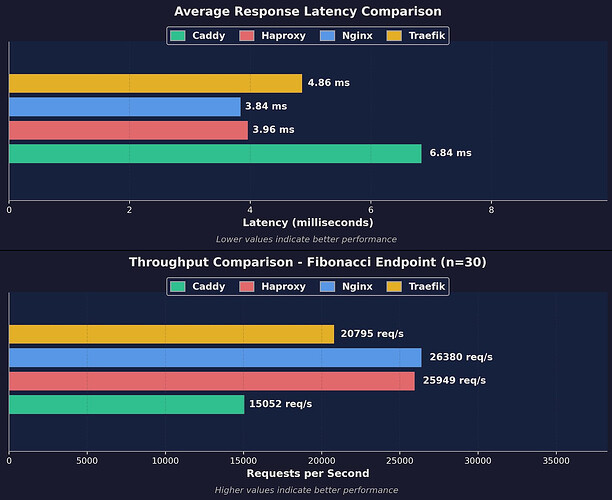
As a long-time Traefik user I wanted to verify the data myself. We mainly use Traefik because of it's great configuration discovery with Docker Swarm.
I got a new 4 vCPU (dedicated) AMD Debian server with 16GB RAM and 160GB SSD. In my initial testing Caddy was always a bit slower than Traefik, so my results are different from OPs.
Plain run (from Github):
Metric                              Nginx              Caddy              Traefik            HAProxy
--------------------------------------------------------------------------------------------------------------
Requests/sec                        25534.59           14966.04           18345.86           26248.37
Avg Latency (ms)                    3.91               6.76               5.49               3.79
50th Percentile (ms)                3.82               6.27               5.16               3.71
75th Percentile (ms)                4.69               8.73               6.78               4.57
90th Percentile (ms)                5.61               11.35              8.61               5.45
99th Percentile (ms)                7.88               16.40              13.46              7.45
Total Requests                      766,981            449,572            551,367            790,062
Another run with Traefik compression disabled and custom settings removed. To my knowledge nginx does not compress by default.
Metric                              Nginx              Caddy              Traefik            HAProxy
--------------------------------------------------------------------------------------------------------------
Requests/sec                        25636.36           14931.26           18976.50           25499.51
Avg Latency (ms)                    3.95               6.82               5.37               3.96
50th Percentile (ms)                3.79               6.29               4.99               3.81
75th Percentile (ms)                4.69               8.76               6.55               4.71
90th Percentile (ms)                5.66               11.36              8.32               5.67
99th Percentile (ms)                8.26               16.74              13.30              8.08
Total Requests                      771,642            448,479            570,175            765,657
Another run with Traefik updated to latest v3 :
Metric                              Nginx              Caddy              Traefik            HAProxy
--------------------------------------------------------------------------------------------------------------
Requests/sec                        25426.58           14930.24           18290.52           25879.90
Avg Latency (ms)                    3.95               6.84               5.60               3.93
50th Percentile (ms)                3.84               6.27               5.16               3.75
75th Percentile (ms)                4.71               8.78               6.80               4.64
90th Percentile (ms)                5.62               11.42              8.70               5.56
99th Percentile (ms)                7.97               16.91              14.28              8.02
Total Requests                      763,535            448,316            549,388            778,968
Traefik v3 with enabled FastProxy :
Metric                              Nginx              Caddy              Traefik            HAProxy
--------------------------------------------------------------------------------------------------------------
Requests/sec                        26380.17           15051.84           20795.49           25948.55
Avg Latency (ms)                    3.84               6.84               4.86               3.96
50th Percentile (ms)                3.68               6.24               4.56               3.73
75th Percentile (ms)                4.54               8.69               5.94               4.65
90th Percentile (ms)                5.45               11.30              7.49               5.63
99th Percentile (ms)                7.93               16.84              11.84              8.25
Total Requests                      792,421            452,070            625,799            779,167
Just for fun I changed the load to fibonacci?n=10 :
Metric                              Nginx              Caddy              Traefik            HAProxy
--------------------------------------------------------------------------------------------------------------
Requests/sec                        25367.56           13573.39           20712.92           24262.62
Avg Latency (ms)                    3.93               7.45               4.85               4.12
50th Percentile (ms)                3.84               6.94               4.58               4.01
75th Percentile (ms)                4.73               9.64               5.97               4.99
90th Percentile (ms)                5.67               12.51              7.54               6.01
99th Percentile (ms)                7.94               18.08              11.54              8.43
Total Requests                      762,070            407,578            622,357            728,559
So for the very specific workload and access pattern it seems nginx and haproxy are doing very well, but I am not sure if those results can be generalized for any kind of workload.
